Soal dan Contoh Jawaban IELTS Writing Section Task 1
Seperti apa sih contoh soal writing IELTS task 1? Yuk simak penjelasan lengkapnya pada artikel ini!
__
Sebagian dari kamu mungkin ada yang jiper untuk mengerjakan writing IELTS. Apalagi, dalam writing test, kamu gak cuman diuji tentang grammar, tapi juga vocabulary atau lexical resource, coherence and cohesion, dan task achievement. Selain itu, dalam IELTS writing section task 1 kamu diminta untuk menganalisis dan menjelaskan grafik, tabel, bagan, atau diagram.
Wih! Lumayan menantang juga, ya. Tapi, selama kamu berlatih dengan tekun dan yakin, kamu pasti bisa mengerjakan tes ini. Jangan lupa juga untuk menghitung jumlah kata yang diminta supaya band score kamu aman dan gak dikurangi.
Supaya kamu makin mantap dalam persiapan writing test task 1, kamu boleh simak beberapa contoh soal serta sampel jawabannya berikut ini ya.
Baca Juga: 4 Keterampilan Berbahasa Inggris dalam IELTS
Contoh IELTS Writing Task 1 Line Graph (Trend Task)
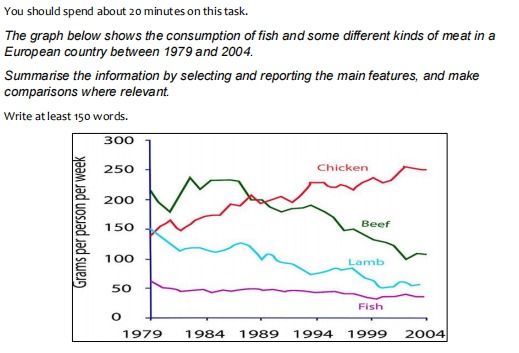
The diagram shows how much different kinds of meat and fish was consumed in a country in Europe from 1979 to 2004.
In the first year, beef was the most popular with a consumption of about 225 grams per person per week. Then, this figure experienced a sudden plunge of 50 before surging to about 230 in 1984. Following this, there were some fluctuations until 1989, after which it decreased dramatically to around half as high as its original level in 2004.
The figure for lamb was initially almost as high as that for chicken (around 150 grams per person per week). However, while the former declined gradually and significantly as it reached approximately 60 in the last year, the latter saw a considerable growth and outstripped beef consumption in 1989, peaking at 250 in 2004.
Fish consumption was originally approximately 60 and experienced a small fall of about 10 over the period.
Overall, although beef was the most popular type of meat at first, it was replaced by chicken towards the end of the survey. In contrast, fish remained the least significant throughout the period.
(183 words)
Contoh IELTS Writing Task 1 Bar Chart (Comparison Task)
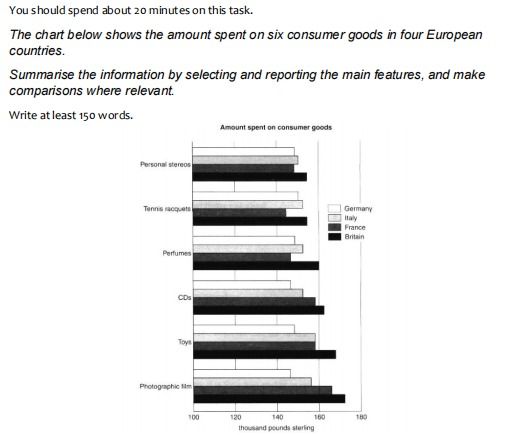
The diagram compares how much money was spent on six different products in Germany, Italy, France and Britain.
In Britain, the highest amount of money was spent on photographic film (more than 170 million pounds), while similar amounts were spent on personal stereos and tennis racquets which together ranked last.
The French spent the second highest amount of money among the four nations on compact disks, toys and photographic film, while they ranked last in personal stereos, tennis racquets and colognes.
Italian consumers spent more money on toys than on any other product (a bit less than £160 million), but they also paid a lot for photographic film.
Finally, Germans spent the least overall, having similar spending figures for all 6 products compared in the chart.
Overall, more money was spent on toys and photographic film than on any other product. Also, the British were the biggest spenders in all six categories among the nations compared in the bar chart, while the lowest spending levels were attributed to German consumers.
(170 words)
Baca Juga: Tips Mengerjakan IELTS Academic Writing Section
Contoh IELTS Writing Task 1 Pie Chart (Comparison Task)
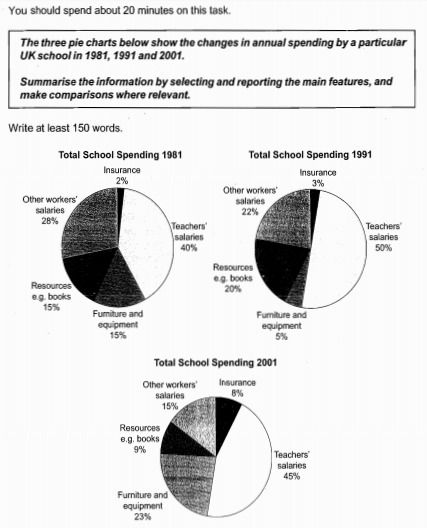
The charts show how much a UK school spent on different running cost in three separate years, 1981, 1991, and 2001.
In all three years, the greatest expenditure was on staff salaries. But while other workers salaries saw a fall from 28% in 1981 to only 15% of spending in 2001, teacher’s pay remained in the biggest cost, reaching 50% of total spending in 1991 and ending 45% in 2001.
Expenditure on resources such as books had increased to 20% by 1991 before decreasing to only 9% by the end of the period in contrast, the cost of furniture and equipment saw an opposite trend. This cost decreased to only 5% of total expenditure in 1991 but rose dramatically in 2001 when it represented 23% of the school budget. Similarly, the cost of insurance saw a rising trend, growing from only 2% to 8% by 2001.
Overall, teachers salaries constituted the largest cost to the school, and while spending increased dramatically for equipment and insurance, there were corresponding drops in expenditure on things, such as books and on other workers salaries.
Contoh IELTS Writing Task 1 Maps (Comparison Maps)
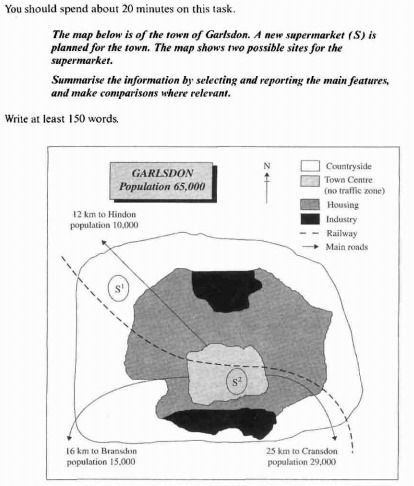
The map shows two proposed locations for a new supermarket for the town of Garlsdon.
The first potential location (S1) is outside the town itself, and is sited just off the main road to the town of Hindon, lying 12 kilometres to the north-west. This site is in the countryside and so would be able to accommodate a lot of car parking. This would make it accessible to shoppers from both Hindon and Garlsdon who could travel by car. Since it is also close to the railway line linking the two towns to Cransdon (25 km to the south-east), a potentially large number of shoppers would also be able to travel by train.
In contrast, the suggested location, S2, is right in the town centre, which would be good for local residents. Theoretically the store could be accessed by road or rail from the surrounding towns, including Bransdon, but as the central area is a no-traffic zone, cars would be unable to park and access would be difficult.
Overall, neither site is appropriate for all the towns, but for customers in Cransdon, Hindon and Garlsdon, the out-of-town site (S1) would probably offer more advantages.
(194 words)
Baca Juga: Contoh Soal IELTS Reading Section dan Pembahasannya
Contoh IELTS Writing Task 1 Diagrams (Process Diagrams)
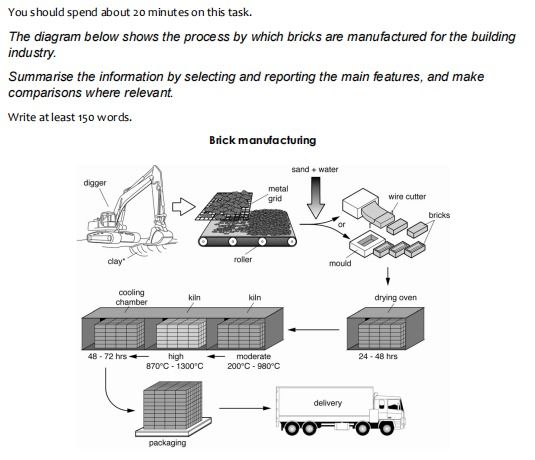
The chart illustrates the procedure through which bricks are produced for construction work.
It commences when raw clay is dug using a digger machine following which it is sifted through a metal grid into finer fragments which then fall onto a conveyor belt. In the next stage, water and sand are added and the resulting mixture is either pushed through a frame and cut into simple bricks, or is moulded into specially-formed bricks. These are then placed in a special oven for two to three days in order to minimize their moisture content. The following three stages involve the use of a couple of kilns and a cooling chamber: bricks are first heated moderately in the first kiln to reach a temperature of between 200 and 980 degrees centigrade before being subjected to higher temperatures (870 to 1300 degrees) in the second one. Next, they are allowed to cool down for two to three days in the cooling chamber. The process ends with the bricks being packed on pallets and delivered to end users on trucks.
Overall, the process of producing bricks is comprised of ten relatively simple stages during which clay, sand and water is used to produce baked bricks.
(201 words)
Contoh IELTS Writing Task 1 Diagrams (Cycles)
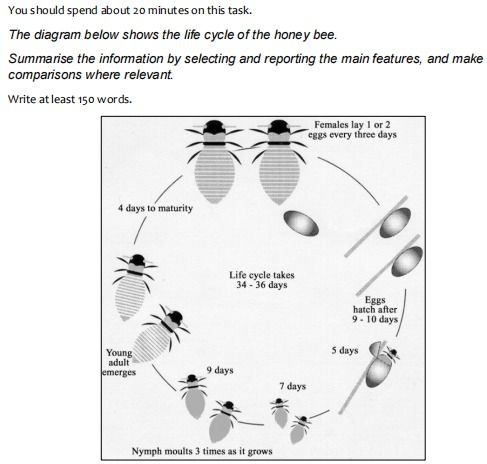
The chart illustrates the stages in the life of honey bees. It takes approximately five weeks (34 to 36 days to be exact) to complete. All in all, this life cycle is comprised of six stages from egg to full maturity.
The first stage is when the female bee lays up to a couple of oval eggs once every 72 hours. These eggs hatch between nine and ten days later, and immature bees, called nymphs, emerge which lack the typical bee stripes.
Over the next 3 weeks nymphs experience three moulting stages, that is, they shed their skins to allow further growth to occur: The first moulting happening 5 days after the eggs hatch, a week after which the second one takes place. Nine days later nymphs moult for a third time and young adult honey bees emerge, identified by their horizontally striped backs. These take four more days to mature into larger adult bees whose backs are marked with bolder and darker stripes, and the cycle starts over again.
(170 words)
Baca Juga: Soal dan Contoh Jawaban IELTS Writing Section Task 2
__
Gimana? Setelah kamu perhatikan beberapa soal dan sampel jawaban dari IELTS writing task 1, kamu makin kebayang dan semakin siap untuk menghadapi tes, kan? I hope you do your best on your test and achieve the highest score for IELTS!
Eits tapi, kalau kamu masih butuh persiapan lebih matang, boleh banget lho daftar dan bergabung di IELTS class English Academy. Di sini kamu akan ketemu mentor-mentor yang sangat kredibel untuk meningkatkan kemampuan bahasa Inggris, khususnya IELTS. Yuk langsung aja daftar!
Referensi:
Cambridge Esol. 2011. Cambridge IELTS 8 Book With Answers. Cambridge: United Kingdom
Tahasoni, Ebrahim. 2015. Master IELTS Visuals (Academic Writing Task 1). [online] Available at: www.tahasoni.com [Accessed 16 November 2023].
Sumber Foto:
Back to school classroom learning on blackboard generated by ai [daring]. Tautan: https://www.freepik.com/free-photo/back-school-classroom-learning-blackboard-generated-by-ai_42129683.htm#page=2&query=classroom&position=13&from_view=search&track=sph&uuid=5036cdac-b09d-44ca-9451-5647629ab4f4 (Diakses: 17 November 2023)

Seperti apa sih contoh soal writing IELTS task 1? Yuk simak penjelasan lengkapnya pada artikel ini!
__
Sebagian dari kamu mungkin ada yang jiper untuk mengerjakan writing IELTS. Apalagi, dalam writing test, kamu gak cuman diuji tentang grammar, tapi juga vocabulary atau lexical resource, coherence and cohesion, dan task achievement. Selain itu, dalam IELTS writing section task 1 kamu diminta untuk menganalisis dan menjelaskan grafik, tabel, bagan, atau diagram.
Wih! Lumayan menantang juga, ya. Tapi, selama kamu berlatih dengan tekun dan yakin, kamu pasti bisa mengerjakan tes ini. Jangan lupa juga untuk menghitung jumlah kata yang diminta supaya band score kamu aman dan gak dikurangi.
Supaya kamu makin mantap dalam persiapan writing test task 1, kamu boleh simak beberapa contoh soal serta sampel jawabannya berikut ini ya.
Baca Juga: 4 Keterampilan Berbahasa Inggris dalam IELTS
Contoh IELTS Writing Task 1 Line Graph (Trend Task)

The diagram shows how much different kinds of meat and fish was consumed in a country in Europe from 1979 to 2004.
In the first year, beef was the most popular with a consumption of about 225 grams per person per week. Then, this figure experienced a sudden plunge of 50 before surging to about 230 in 1984. Following this, there were some fluctuations until 1989, after which it decreased dramatically to around half as high as its original level in 2004.
The figure for lamb was initially almost as high as that for chicken (around 150 grams per person per week). However, while the former declined gradually and significantly as it reached approximately 60 in the last year, the latter saw a considerable growth and outstripped beef consumption in 1989, peaking at 250 in 2004.
Fish consumption was originally approximately 60 and experienced a small fall of about 10 over the period.
Overall, although beef was the most popular type of meat at first, it was replaced by chicken towards the end of the survey. In contrast, fish remained the least significant throughout the period.
(183 words)
Contoh IELTS Writing Task 1 Bar Chart (Comparison Task)

The diagram compares how much money was spent on six different products in Germany, Italy, France and Britain.
In Britain, the highest amount of money was spent on photographic film (more than 170 million pounds), while similar amounts were spent on personal stereos and tennis racquets which together ranked last.
The French spent the second highest amount of money among the four nations on compact disks, toys and photographic film, while they ranked last in personal stereos, tennis racquets and colognes.
Italian consumers spent more money on toys than on any other product (a bit less than £160 million), but they also paid a lot for photographic film.
Finally, Germans spent the least overall, having similar spending figures for all 6 products compared in the chart.
Overall, more money was spent on toys and photographic film than on any other product. Also, the British were the biggest spenders in all six categories among the nations compared in the bar chart, while the lowest spending levels were attributed to German consumers.
(170 words)
Baca Juga: Tips Mengerjakan IELTS Academic Writing Section
Contoh IELTS Writing Task 1 Pie Chart (Comparison Task)

The charts show how much a UK school spent on different running cost in three separate years, 1981, 1991, and 2001.
In all three years, the greatest expenditure was on staff salaries. But while other workers salaries saw a fall from 28% in 1981 to only 15% of spending in 2001, teacher’s pay remained in the biggest cost, reaching 50% of total spending in 1991 and ending 45% in 2001.
Expenditure on resources such as books had increased to 20% by 1991 before decreasing to only 9% by the end of the period in contrast, the cost of furniture and equipment saw an opposite trend. This cost decreased to only 5% of total expenditure in 1991 but rose dramatically in 2001 when it represented 23% of the school budget. Similarly, the cost of insurance saw a rising trend, growing from only 2% to 8% by 2001.
Overall, teachers salaries constituted the largest cost to the school, and while spending increased dramatically for equipment and insurance, there were corresponding drops in expenditure on things, such as books and on other workers salaries.
Contoh IELTS Writing Task 1 Maps (Comparison Maps)

The map shows two proposed locations for a new supermarket for the town of Garlsdon.
The first potential location (S1) is outside the town itself, and is sited just off the main road to the town of Hindon, lying 12 kilometres to the north-west. This site is in the countryside and so would be able to accommodate a lot of car parking. This would make it accessible to shoppers from both Hindon and Garlsdon who could travel by car. Since it is also close to the railway line linking the two towns to Cransdon (25 km to the south-east), a potentially large number of shoppers would also be able to travel by train.
In contrast, the suggested location, S2, is right in the town centre, which would be good for local residents. Theoretically the store could be accessed by road or rail from the surrounding towns, including Bransdon, but as the central area is a no-traffic zone, cars would be unable to park and access would be difficult.
Overall, neither site is appropriate for all the towns, but for customers in Cransdon, Hindon and Garlsdon, the out-of-town site (S1) would probably offer more advantages.
(194 words)
Baca Juga: Contoh Soal IELTS Reading Section dan Pembahasannya
Contoh IELTS Writing Task 1 Diagrams (Process Diagrams)

The chart illustrates the procedure through which bricks are produced for construction work.
It commences when raw clay is dug using a digger machine following which it is sifted through a metal grid into finer fragments which then fall onto a conveyor belt. In the next stage, water and sand are added and the resulting mixture is either pushed through a frame and cut into simple bricks, or is moulded into specially-formed bricks. These are then placed in a special oven for two to three days in order to minimize their moisture content. The following three stages involve the use of a couple of kilns and a cooling chamber: bricks are first heated moderately in the first kiln to reach a temperature of between 200 and 980 degrees centigrade before being subjected to higher temperatures (870 to 1300 degrees) in the second one. Next, they are allowed to cool down for two to three days in the cooling chamber. The process ends with the bricks being packed on pallets and delivered to end users on trucks.
Overall, the process of producing bricks is comprised of ten relatively simple stages during which clay, sand and water is used to produce baked bricks.
(201 words)
Contoh IELTS Writing Task 1 Diagrams (Cycles)

The chart illustrates the stages in the life of honey bees. It takes approximately five weeks (34 to 36 days to be exact) to complete. All in all, this life cycle is comprised of six stages from egg to full maturity.
The first stage is when the female bee lays up to a couple of oval eggs once every 72 hours. These eggs hatch between nine and ten days later, and immature bees, called nymphs, emerge which lack the typical bee stripes.
Over the next 3 weeks nymphs experience three moulting stages, that is, they shed their skins to allow further growth to occur: The first moulting happening 5 days after the eggs hatch, a week after which the second one takes place. Nine days later nymphs moult for a third time and young adult honey bees emerge, identified by their horizontally striped backs. These take four more days to mature into larger adult bees whose backs are marked with bolder and darker stripes, and the cycle starts over again.
(170 words)
Baca Juga: Soal dan Contoh Jawaban IELTS Writing Section Task 2
__
Gimana? Setelah kamu perhatikan beberapa soal dan sampel jawaban dari IELTS writing task 1, kamu makin kebayang dan semakin siap untuk menghadapi tes, kan? I hope you do your best on your test and achieve the highest score for IELTS!
Eits tapi, kalau kamu masih butuh persiapan lebih matang, boleh banget lho daftar dan bergabung di IELTS class English Academy. Di sini kamu akan ketemu mentor-mentor yang sangat kredibel untuk meningkatkan kemampuan bahasa Inggris, khususnya IELTS. Yuk langsung aja daftar!
Referensi:
Cambridge Esol. 2011. Cambridge IELTS 8 Book With Answers. Cambridge: United Kingdom
Tahasoni, Ebrahim. 2015. Master IELTS Visuals (Academic Writing Task 1). [online] Available at: www.tahasoni.com [Accessed 16 November 2023].
Sumber Foto:
Back to school classroom learning on blackboard generated by ai [daring]. Tautan: https://www.freepik.com/free-photo/back-school-classroom-learning-blackboard-generated-by-ai_42129683.htm#page=2&query=classroom&position=13&from_view=search&track=sph&uuid=5036cdac-b09d-44ca-9451-5647629ab4f4 (Diakses: 17 November 2023)


